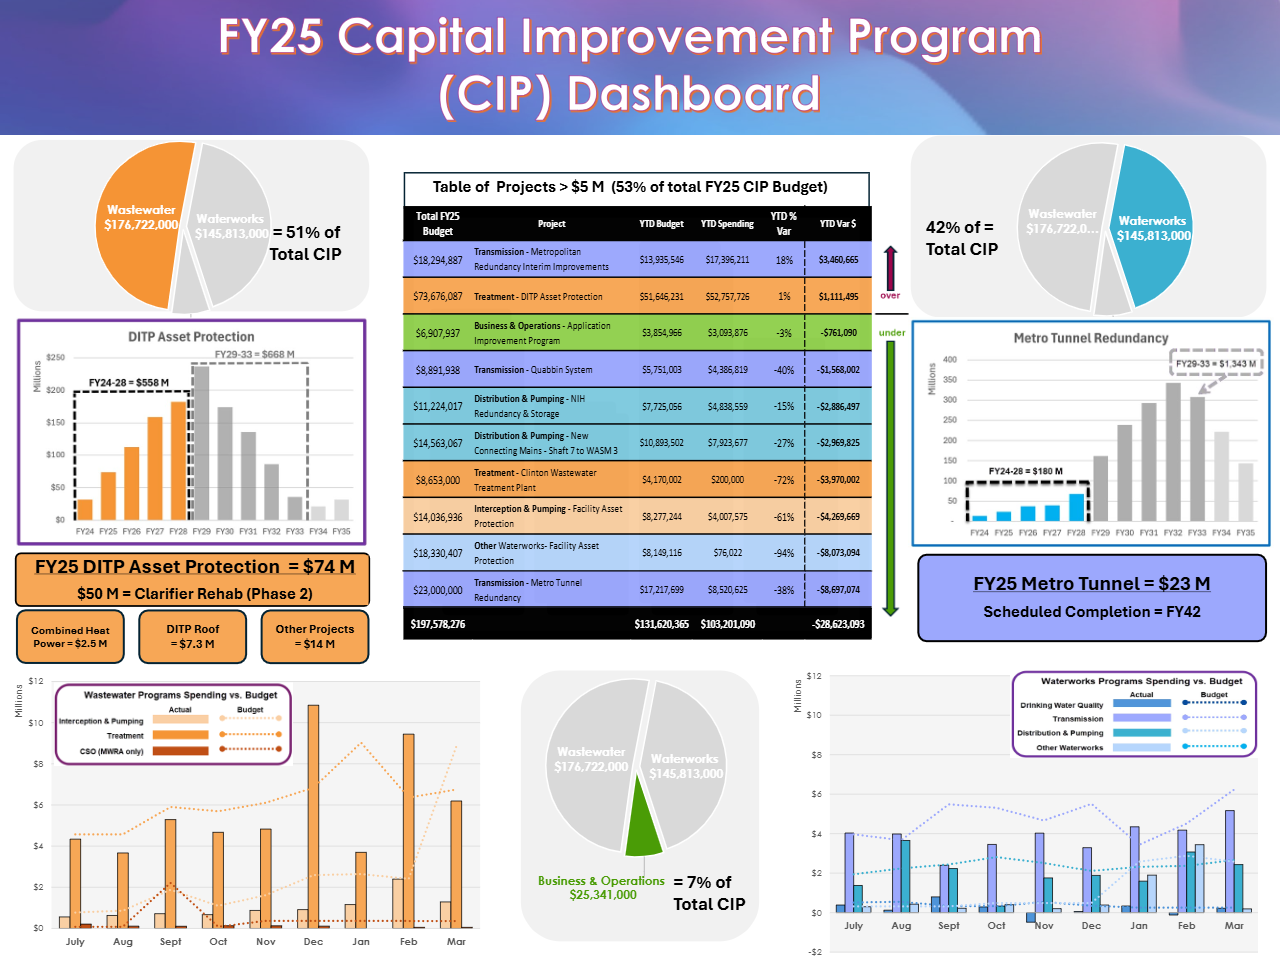
Select a dashboard to open the full interactive view in a new tab or static report to download. **** NOTE***** Live Power BI reports may take a few seconds to load their data.
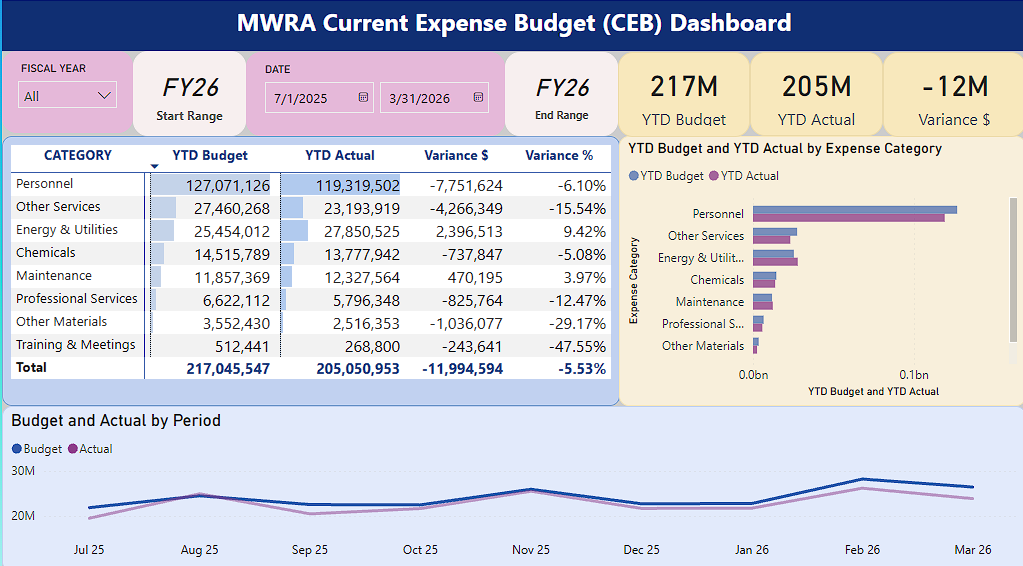
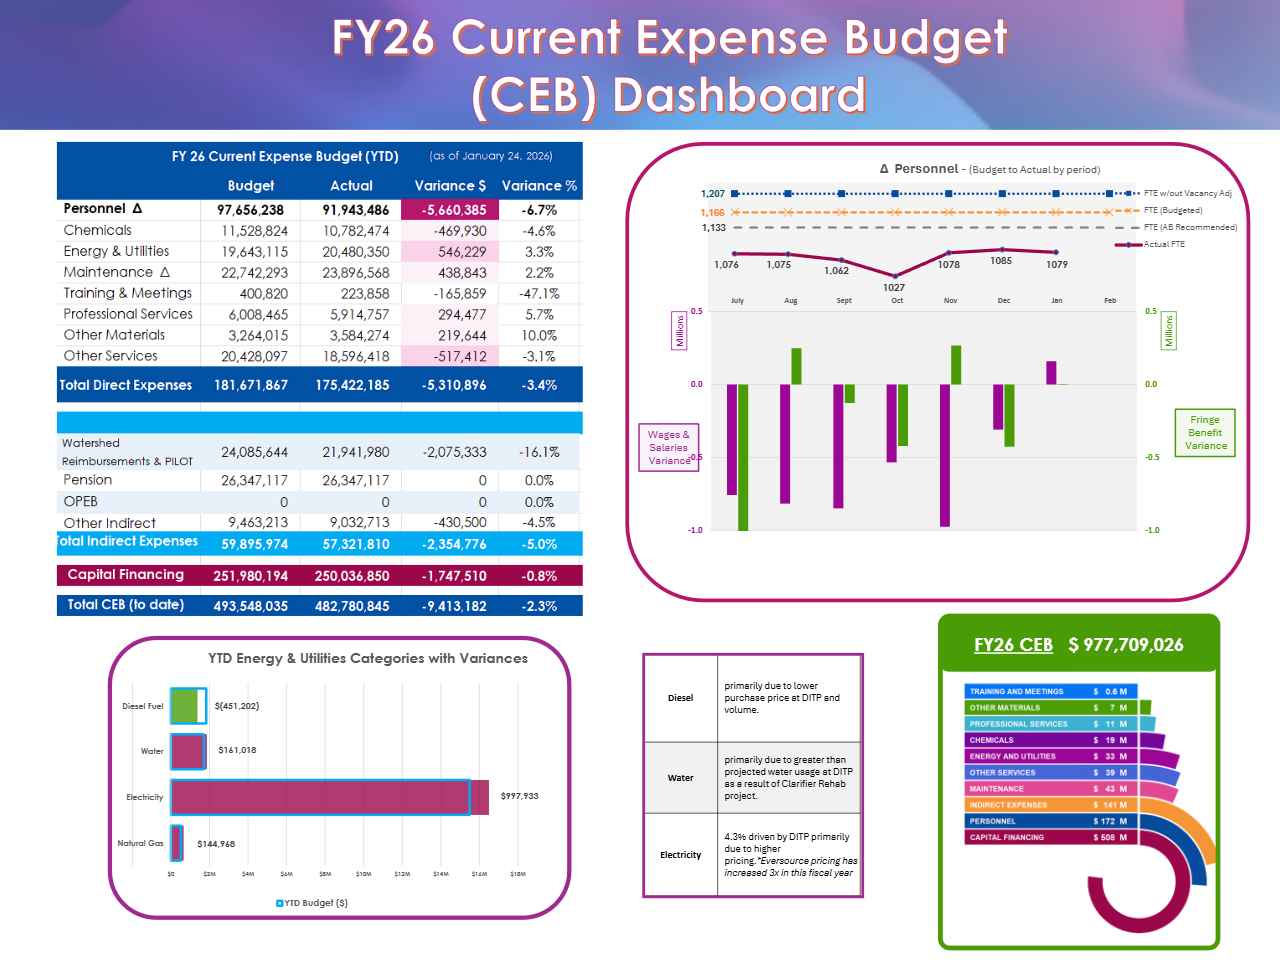
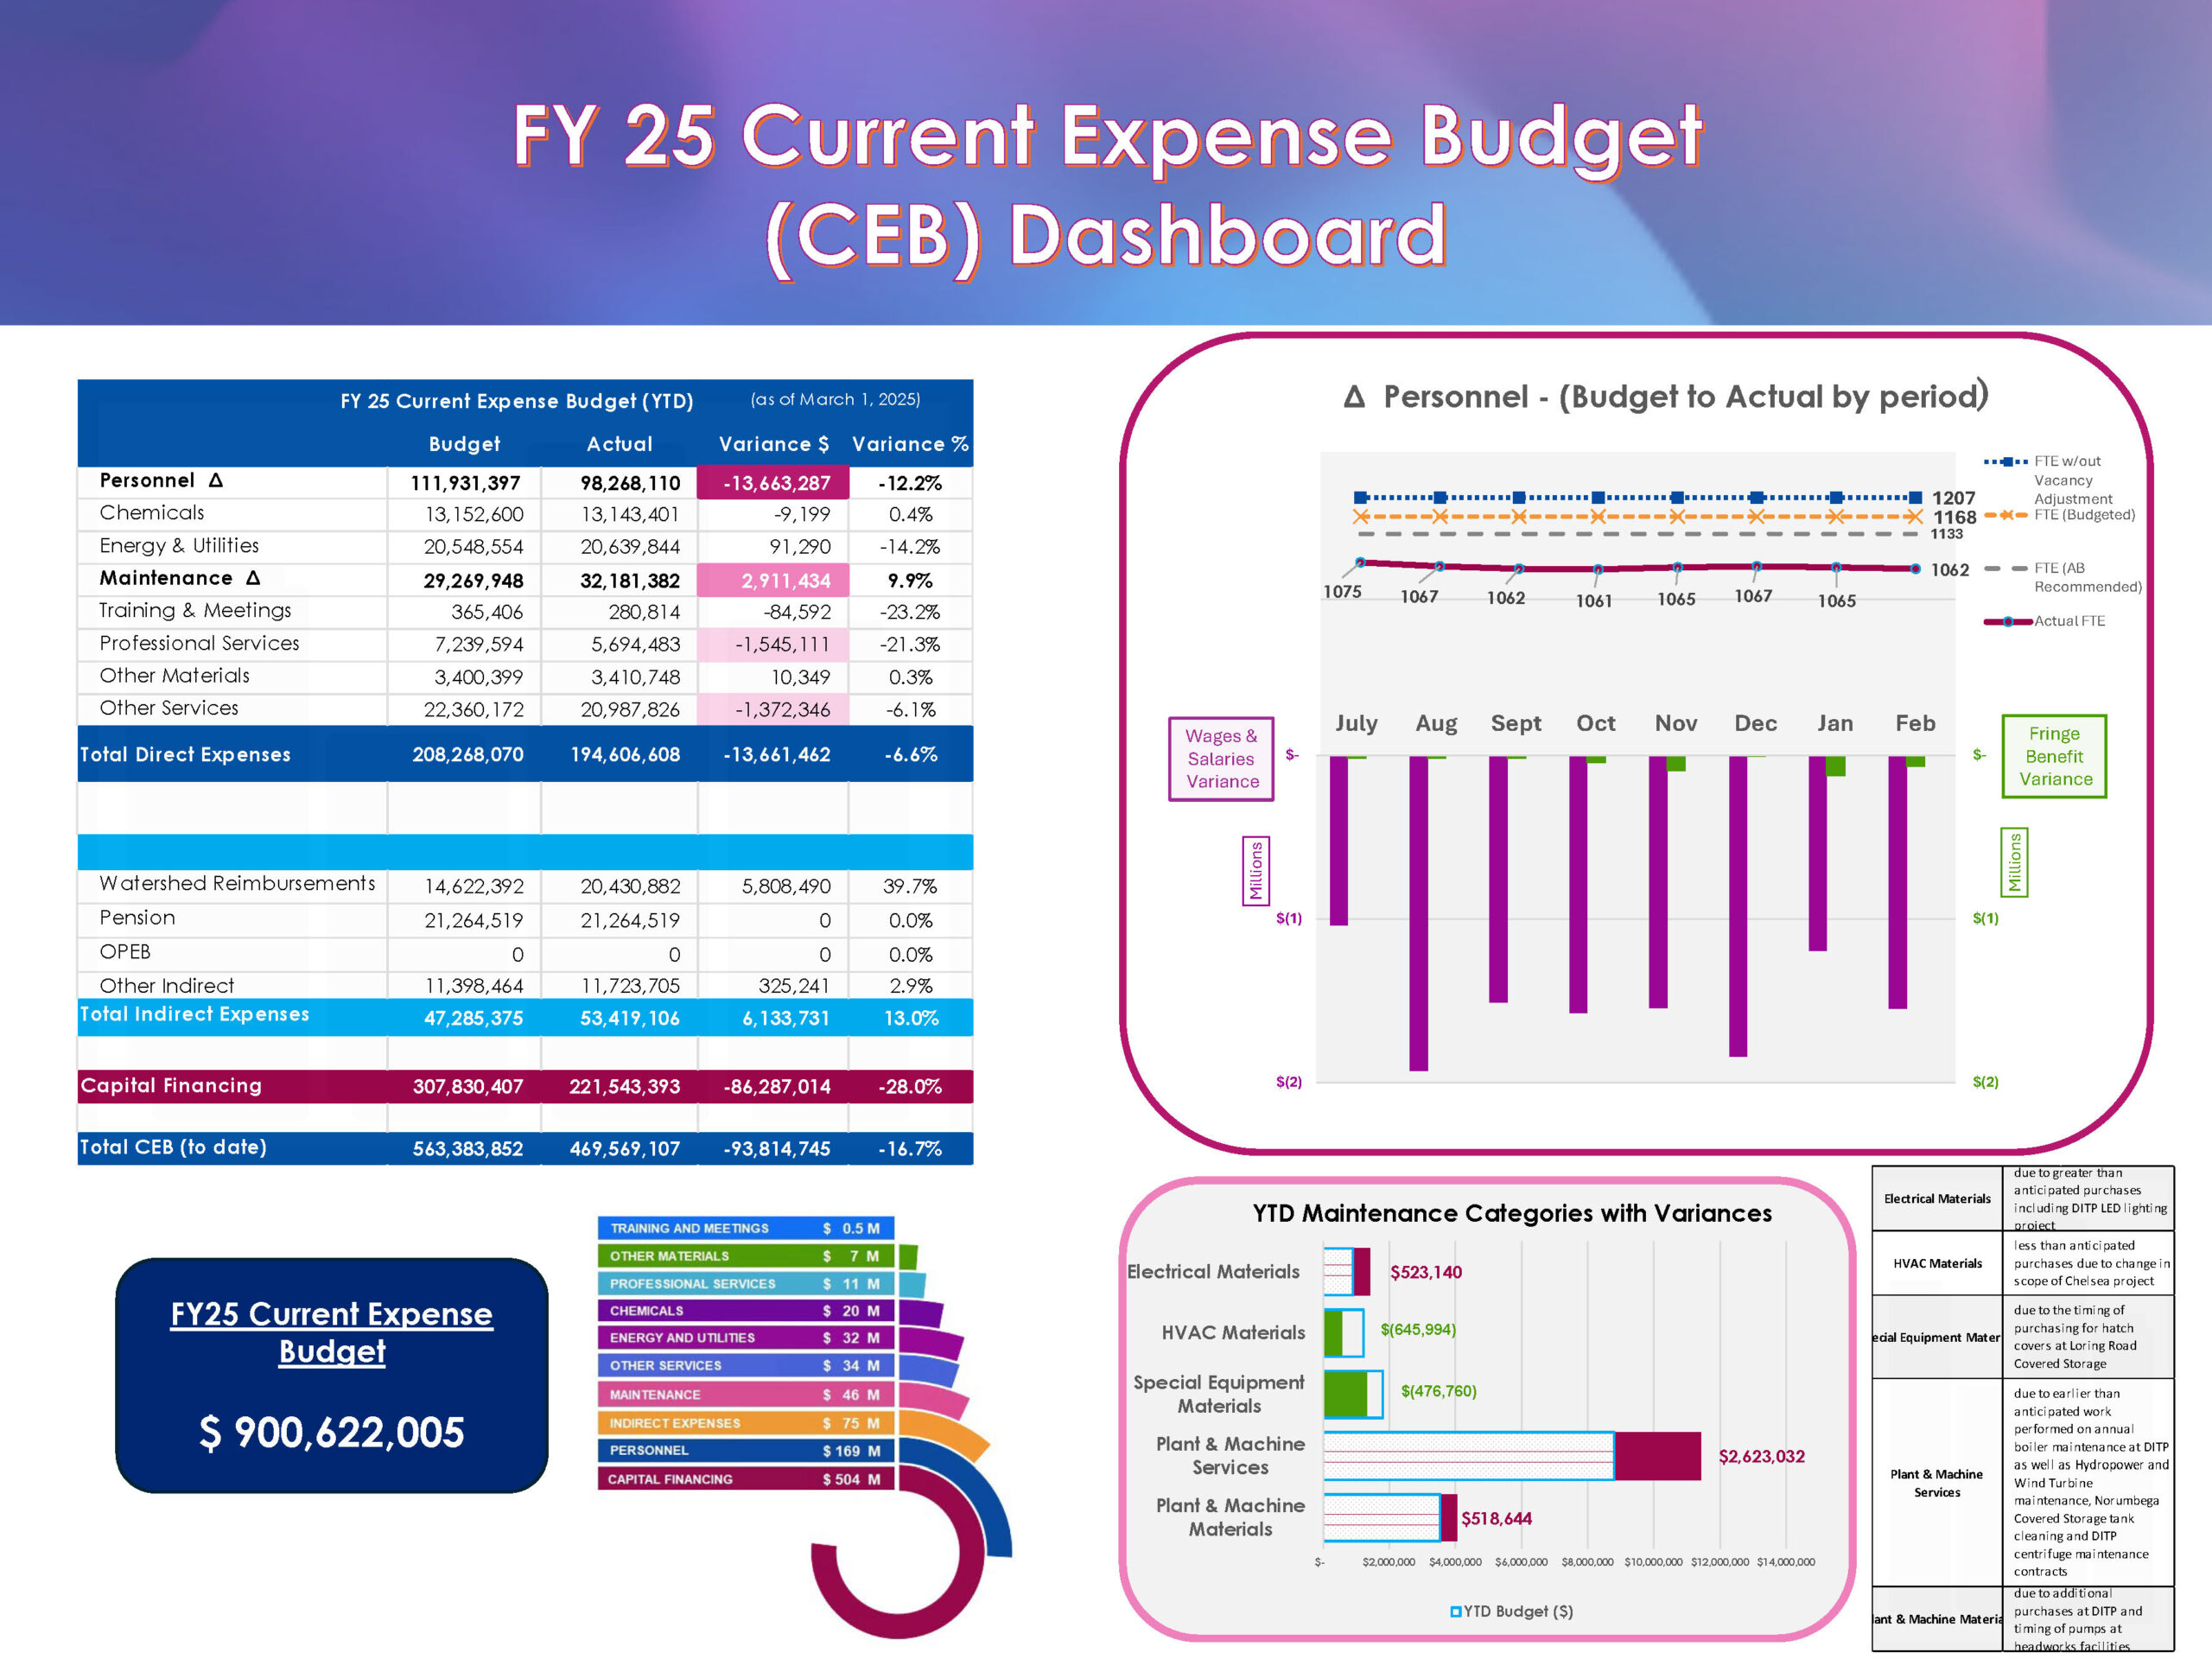
Monthly, YTD & year-over-year performance, expense category details and variance alerts
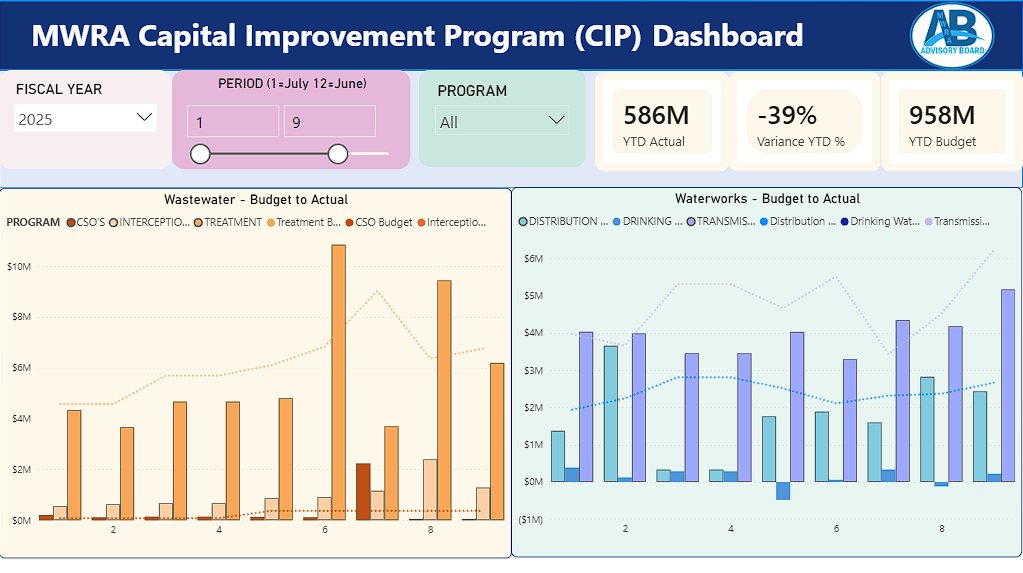
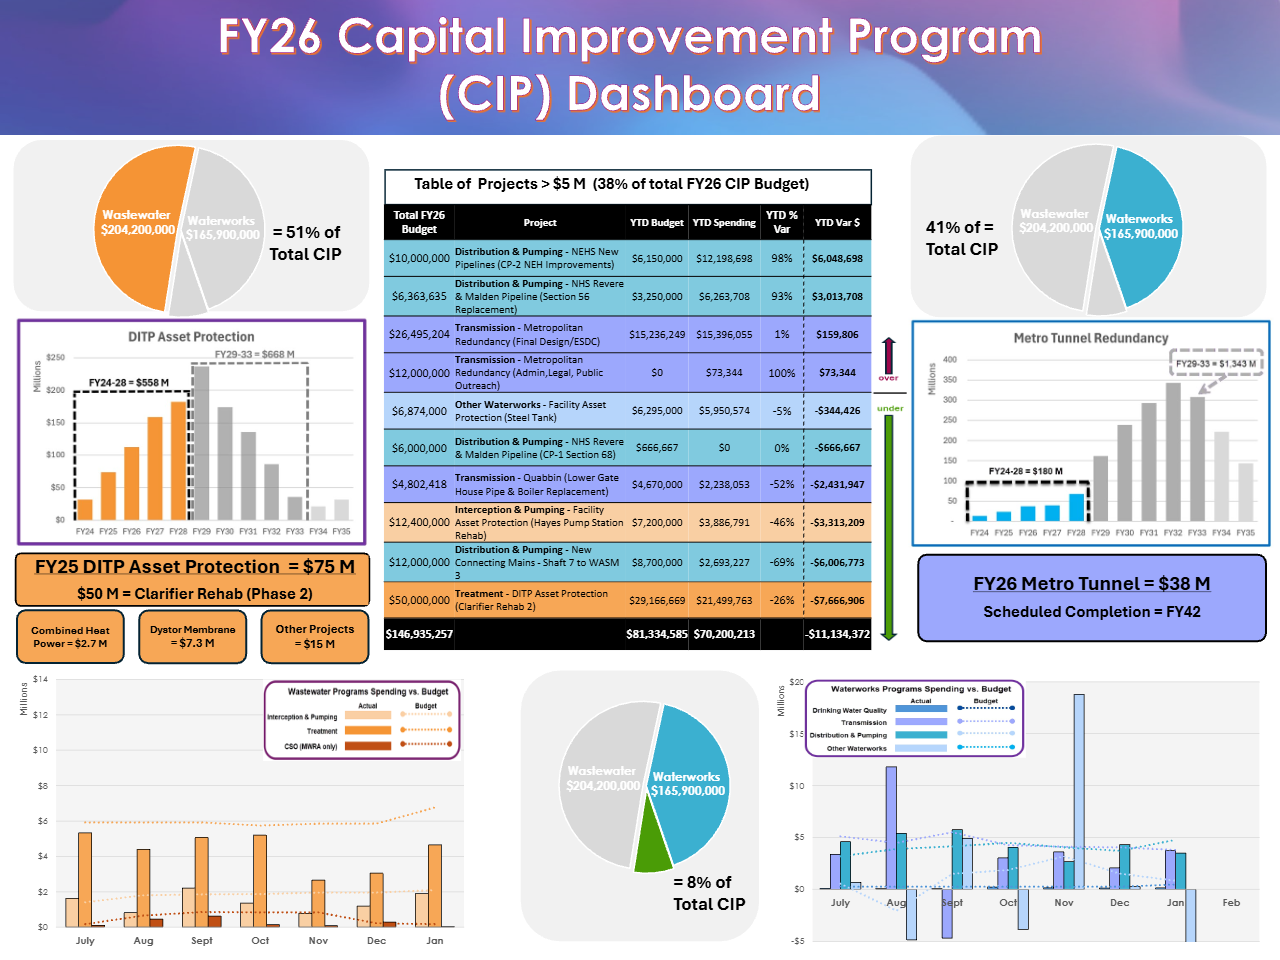
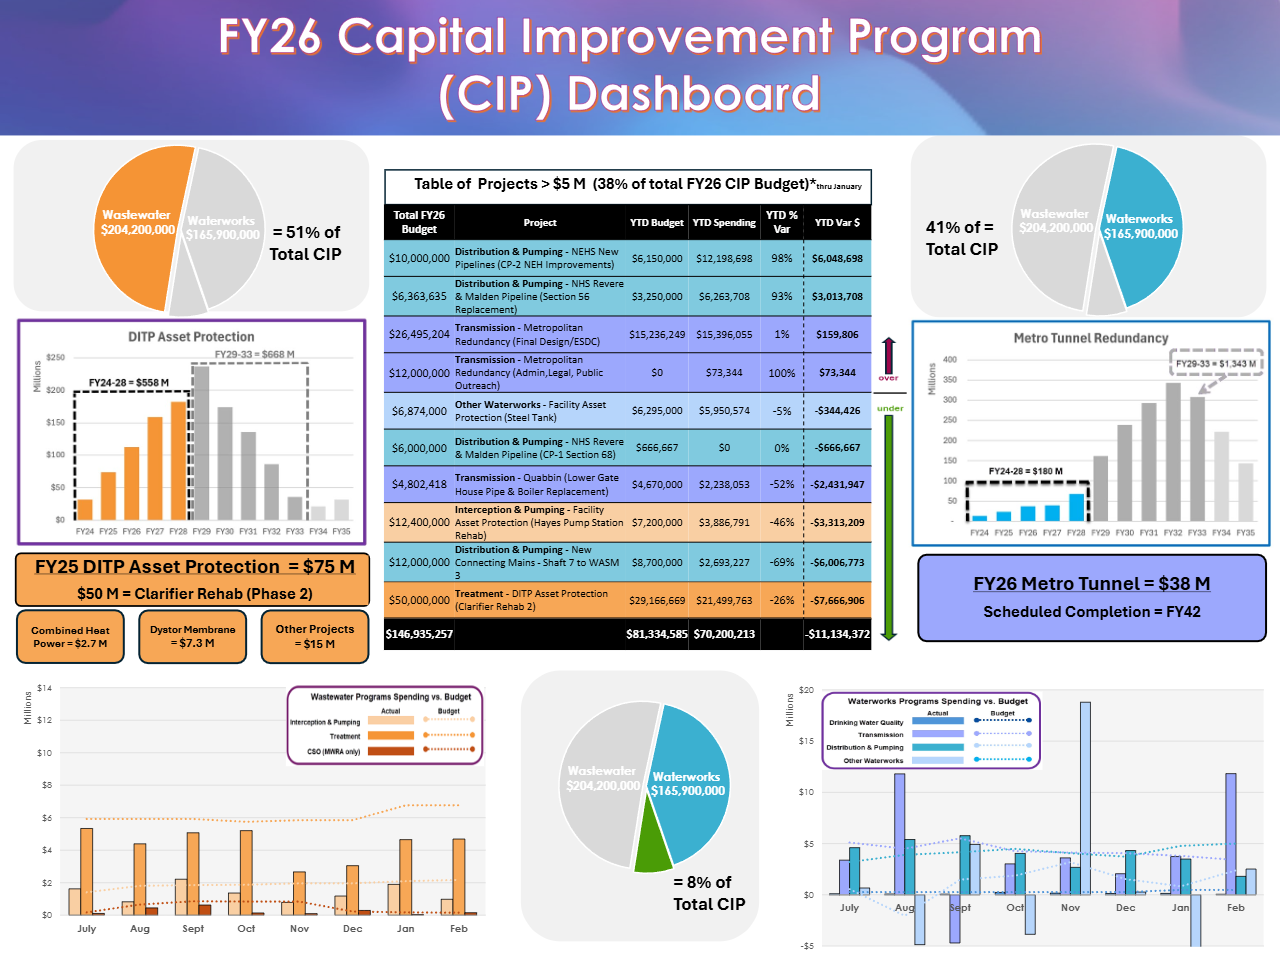
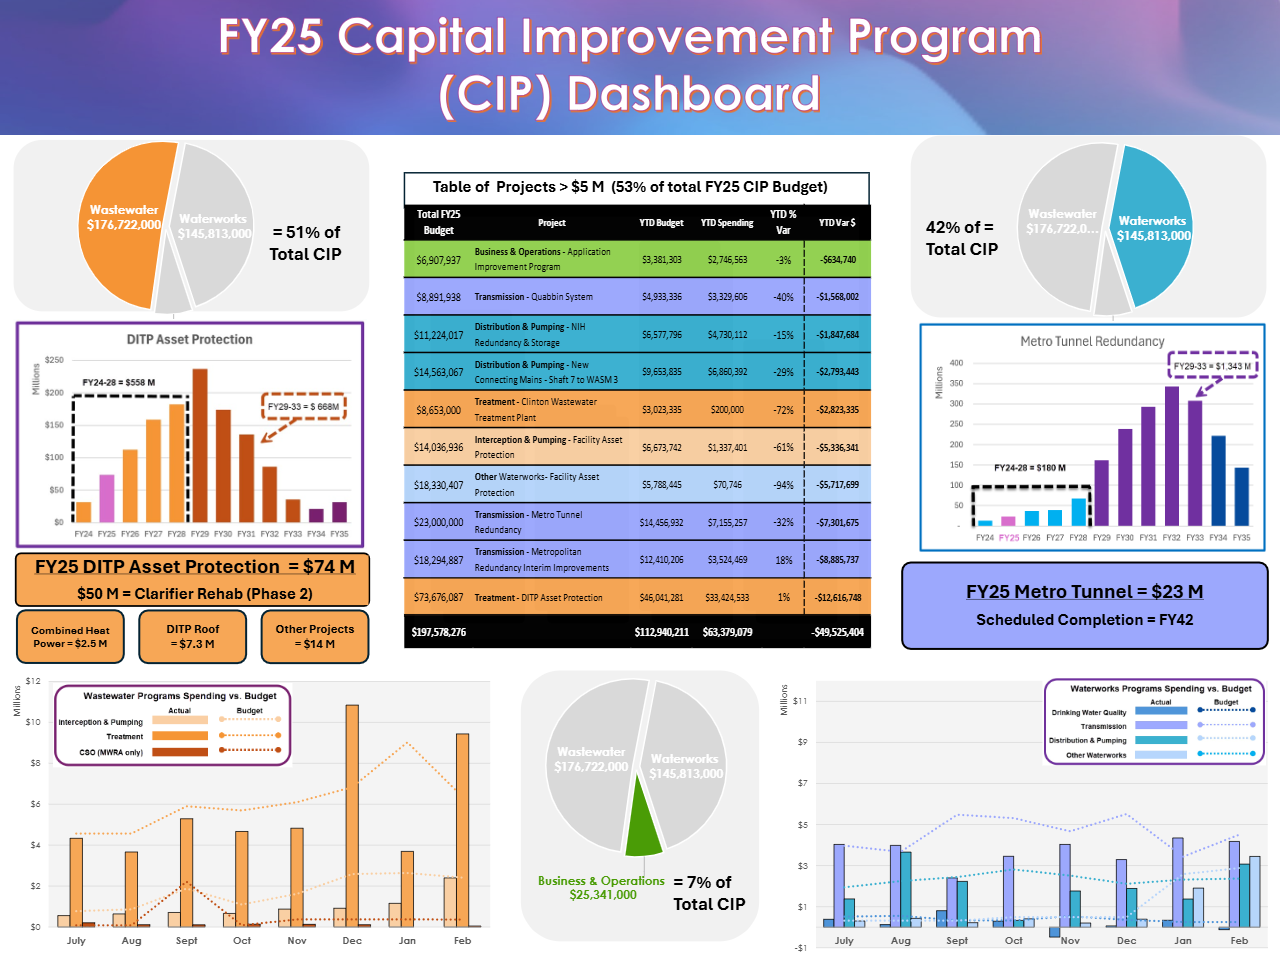
Capital Improvement Program performance by utility
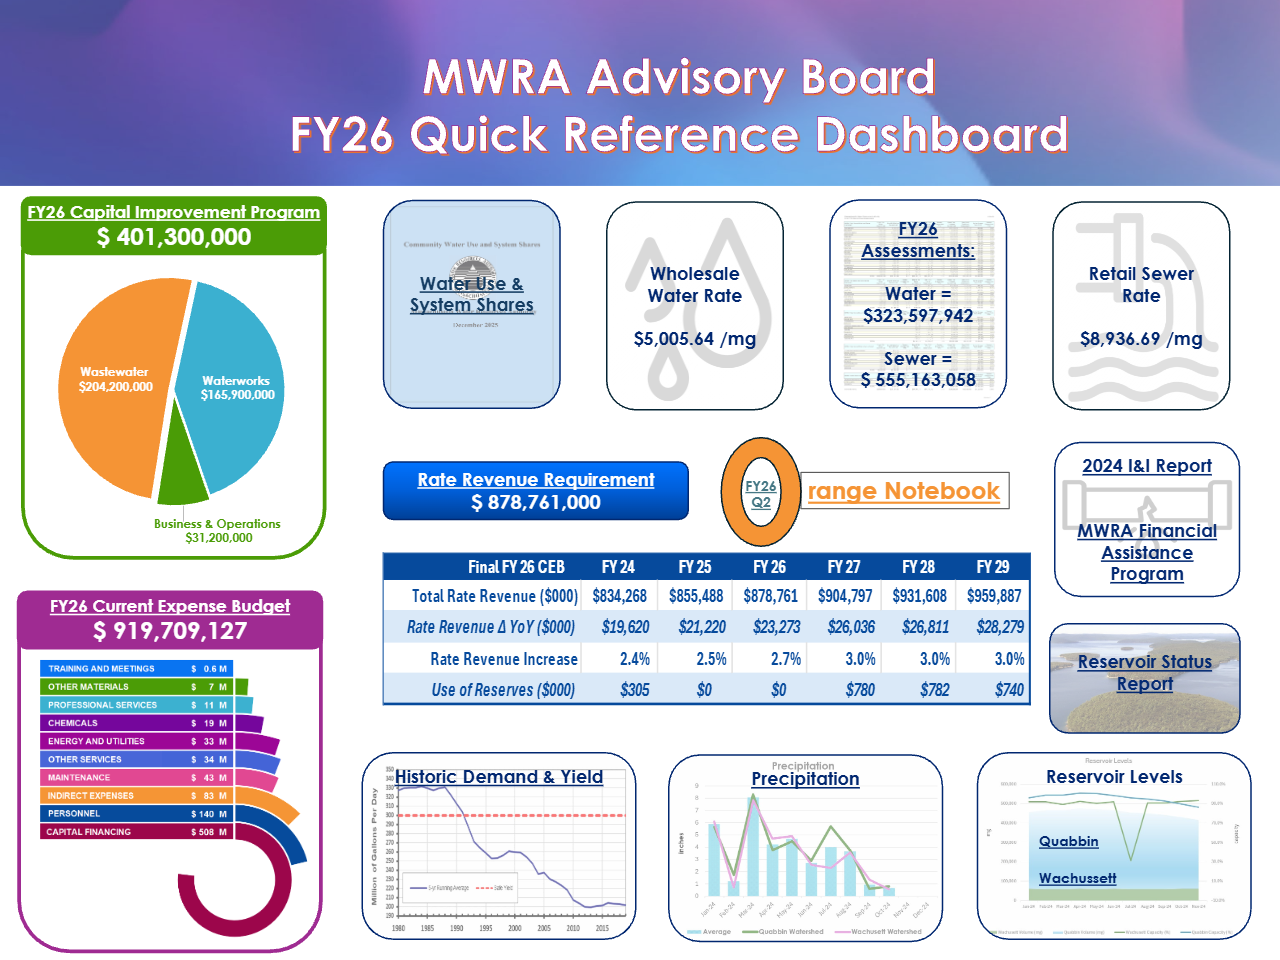
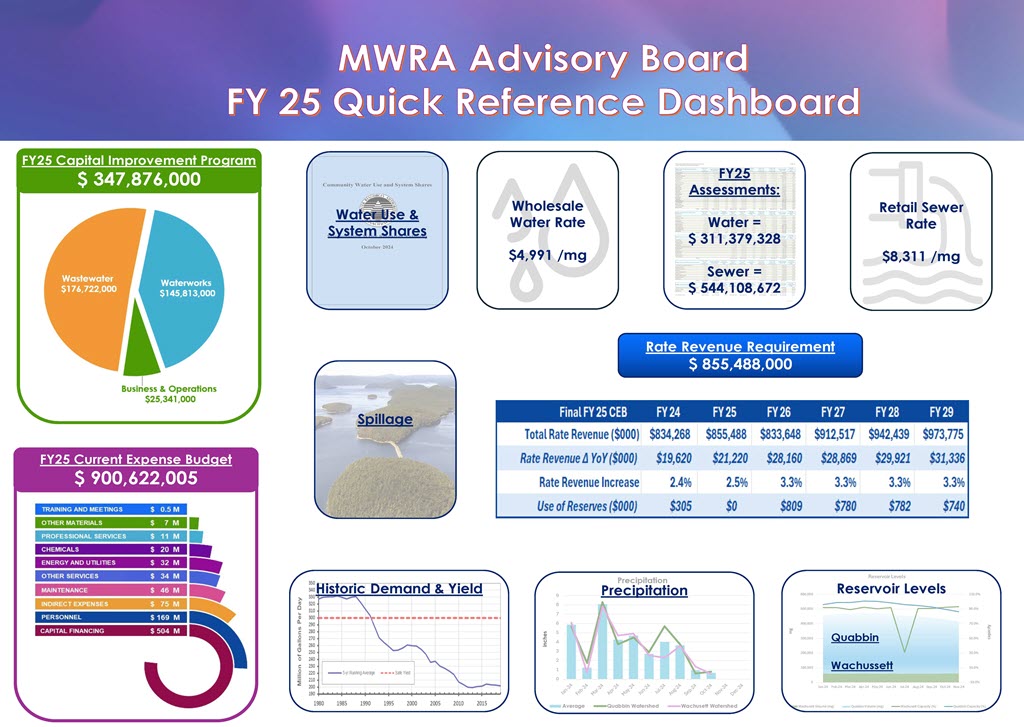
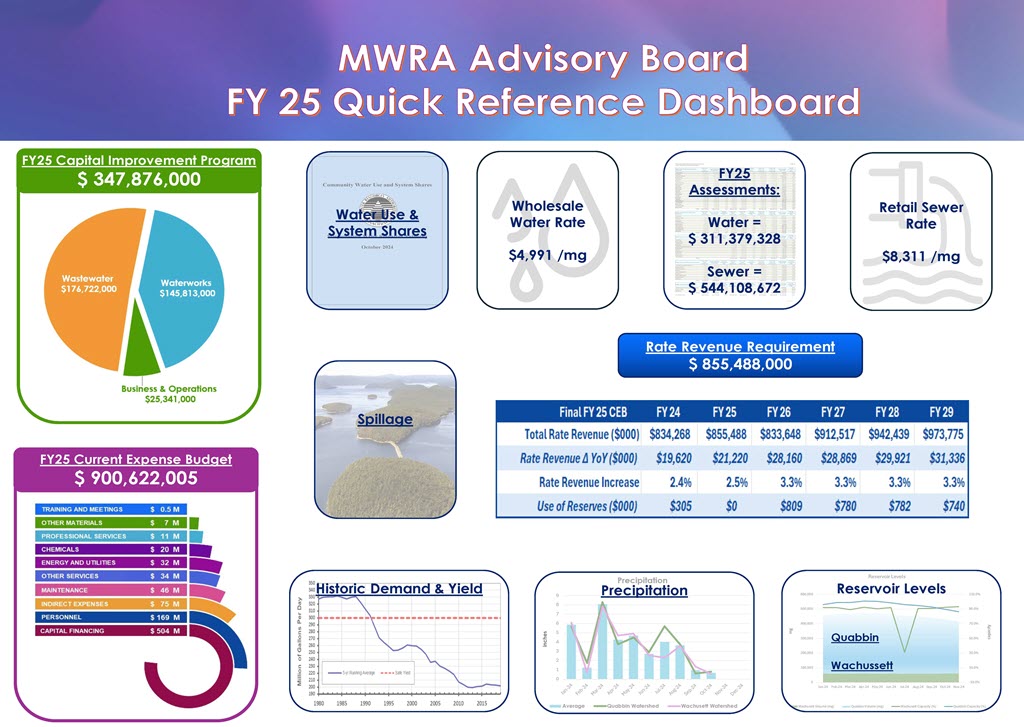
A fast, mobile-friendly snapshot of the numbers and reports ratepayers and decision makers ask about most
Below Normal range
Normal range
August (Quabbin)
avg. daily vs. 300 mgd safe yielded
Year-over-year change
Share of the current expense budget
FY27 Wholesale Water Rate
FY27 Retail Sewer Rate